So back when I taught ArcGIS classes – I always deviated into data collection. We were mostly teaching how the software works and we had these perfect scenarios to work though. So I always turned into one of the dirtier projects I had worked with and covered subtypes and domains. If you’re using ArcGIS and you’ve never dived into that side of data editing – take a look. It might make your attribution life easier.
I’ve moved two clients into QGIS now. Not because of any great push on my part – it’s mostly been just because they needed more flexibility and the budgets were tight…that and we needed to worry about data more than anything. I almost set this up and some last minute changes left me finishing the editing so I didn’t – but it’s worth a mention.
How do you control attribution in QGIS? We’ve all seen the Road, Rd, road, rod, rad problem when people are left to their own devices in editing. I never will forget way back in my federal days we had a data capture exercise that involved employees names. I was a unwashed database heathen (still am mostly) and the college students that were tasked with the collection portion spelled one employees name about 15 different ways. It was awesome. It was horrifying.
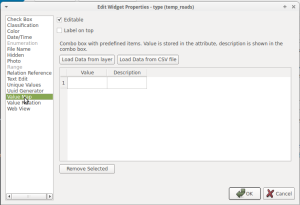
So if you load data (points lines or polygons) into QGIS and right click on that layer go to to properties -> fields. You can do some pretty cool things. There are 16 (or maybe more) widgets that you can assign to a field. For this exercise I have a road layer and a type field. I want the attributes to be: Road, Street, Avenue, Circle, Loop etc (and I’m making these up).
Fields Menu:
If you click Text Edit:
And you put in a description and a value. The Description is shown and the value is recorded in the data. I was being a bit silly in my data descriptions.
BUT – you can control your data attribution. No more StReets<return> or RODs. It makes your life a bit easier.
Also – please note when you’re looking at the Edit Widget Properties (where you’re putting the values and descriptions) – note you can load a CSV file so you can keep those centrally located. Write some directions and complete it with “Thou shalt load the values from the CSV File”.
More importantly I’ve been really focusing on PostGIS/Postgresql and databases. If you really want to live dangerously – load your data into postgis and start creating tables and foreign keys. Treat your data like a database. So can you leverage that table full of foreign keys? I’ve got one table currently that has 34 Values. I can load those 34 Values into this Value map widget and my data collectors don’t need to worry about my foreign keys and joins.
Finally – what you see when you’re editing – A drop down list to help your data input.
Make your life easer – explore widgets if you’re using QGIS to help out you and your data.


